






Cost optimization
What Is Amazon CloudWatch and Why It Matters for AWS Costs

Amazon CloudWatch is AWS’s built-in monitoring, observability, alerting, and automation service that collects data from EC2, Lambda, RDS, containers, and applications, turns that data into metrics, logs, traces, dashboards, and alarms, and helps both engineering and finance teams connect system behavior, performance risk, and cloud spend in near real time.
That last part matters more than many teams expect. When usage changes, costs often change too, so CloudWatch can help you spot both technical issues and budget drift before they turn into bigger problems.
What Amazon CloudWatch does and why AWS teams rely on it
CloudWatch gives AWS teams one place to watch how systems behave. AWS describes it as a service for monitoring AWS resources and applications with system-wide observability, which is a useful starting point in the official CloudWatch overview.
Monitoring and observability sound alike, but they aren’t the same. Monitoring tells you what happened. Observability helps you figure out why it happened.
That difference matters when an app slows down at noon every day. A basic monitor might show high CPU on EC2. A more complete observability setup can connect CPU, request latency, logs, and upstream service calls, so the team can trace the real cause.
Monitoring tells you something broke. Observability helps you explain the break.
CloudWatch helps teams cut downtime because it shows early warning signs. It also supports better reliability because teams can act before users notice trouble. For finance leaders, the value is broader. Usage graphs and alarms can expose odd spikes, idle resources, or sudden log growth that push bills higher.
The simplest way to think about CloudWatch
Think of CloudWatch as a control room for your AWS environment. EC2, Lambda, RDS, containers, and applications send signals in. CloudWatch turns those signals into charts, alerts, and actions.

If the room stays quiet, things are probably healthy. If alarms fire or a graph bends the wrong way, teams know where to look first.
Why CloudWatch matters to finance leaders too
Finance teams may never open a terminal, but they still care about CloudWatch data. Resource behavior often explains spend behavior.
For example, a steady overnight CPU pattern can reveal EC2 instances that never shut down. Memory pressure can show an undersized app that keeps scaling out. A sudden traffic surge can explain both latency and a larger bill. In growing companies, that kind of visibility supports active cloud oversight instead of end-of-month surprises.
See how much you can save on your stack
Pick your team’s tools!
Click to select one or more tools.


What’s your company size?
Just click to select.
What’s your business email?
We'll send you calculations right away
The email is flying to your inbox!
Beyond discounts, you may qualify for up to $100K in AWS credits.

The core parts of Amazon CloudWatch, explained in plain English
CloudWatch has a few main building blocks. Each one answers a different type of question. Together, they help teams see, understand, and respond.
This quick comparison makes the split easier to remember:
| Signal type | What it shows | Best for | Example |
|---|---|---|---|
| Metrics | Numbers over time | Trends and thresholds | CPU, latency, request count |
| Logs | Detailed event records | Debugging and audits | App errors, login failures |
| Traces | Request paths across services | Root-cause analysis | A slow checkout request |
The takeaway is simple. One graph rarely tells the full story, but these signals together often do.
Metrics, logs, and traces each answer a different question
Metrics are the fastest read. They show patterns over time, such as CPU, disk I/O, request count, or duration. They’re great for spotting a problem.
Logs add detail. They record events line by line, so teams can inspect failed requests, timeout messages, or app warnings. When metrics say “something is wrong,” logs often say “here’s the event.”
Traces follow a request across services. In a modern app, one user action may hit an API, a queue, a Lambda function, and a database. Traces help teams find where the delay started. AWS lays out these capabilities in its CloudWatch features page.
Dashboards, alarms, and agents turn raw data into action
Dashboards organize key metrics and logs in one view. Teams use them for daily checks, incident calls, and executive snapshots.
Alarms watch for thresholds or patterns. If CPU stays high, an alarm can notify a team, open a workflow, or trigger an automated step. The CloudWatch agent extends visibility by collecting memory, disk, and other server-level data from EC2 or even on-prem systems.
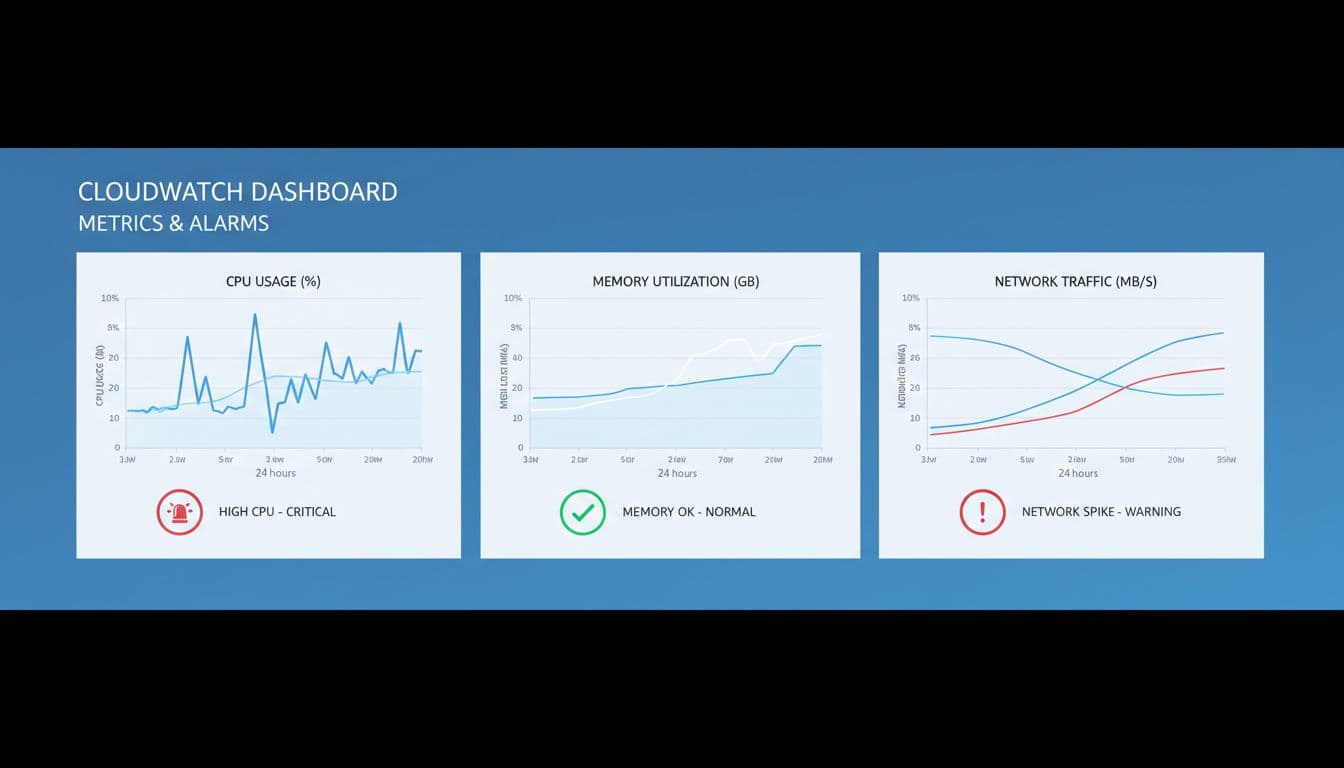
That matters because default AWS metrics don’t show everything. If you want memory usage on an EC2 instance, you usually need an agent or custom data source.
How Amazon CloudWatch works inside a real AWS environment
The flow is straightforward. First, data comes in from AWS services, agents, and apps. Next, CloudWatch stores and analyzes that data. Then teams visualize it in dashboards or queries. Finally, alarms and automation respond.
Many AWS services publish default metrics automatically. EC2 sends CPU and network activity. Lambda sends invocations, errors, and duration. RDS and container services send health and performance signals too. Custom applications can also push extra metrics or logs when default data isn’t enough.
What data CloudWatch collects automatically, and what you add yourself
Built-in metrics cover a lot, but not every business signal. Teams often add custom metrics for orders per minute, failed payments, or tenant-specific load. They may also ship application logs through agents, log drivers, or OpenTelemetry.
That extra data is where CloudWatch becomes more useful for finance and ops. A team can connect infrastructure signals with app behavior and revenue events, then see which workload causes the spike.
Larger companies also need broader views. CloudWatch supports cross-account and multi-region monitoring, so central teams can watch fleets spread across many AWS accounts without logging into each one.
How alerts and automated responses help prevent bigger problems
CloudWatch alarms can send notifications through Amazon SNS, trigger AWS Lambda functions, or feed Auto Scaling decisions. That means alerts don’t have to stop at email.
A common example is sustained high CPU. CloudWatch can notify the team and scale a service out. Another example is waste control. If a non-critical dev instance stays idle after hours, an alarm-driven workflow can shut it down and trim spend.
This is where monitoring stops being passive. It starts acting like a guardrail.
Key Amazon CloudWatch features that stand out in 2026
CloudWatch has grown past simple graphs. In 2026, the standout features focus on faster detection, cleaner investigation, and better visibility across large AWS organizations.
Logs Insights remains one of the most useful tools because teams can query large log sets without exporting data first. Application and infrastructure dashboards also keep improving, especially for container-heavy environments. Recent CloudWatch experiences have also leaned toward AI-assisted investigation, with summaries and clues that help teams narrow where to look first, while still leaving the final judgment to humans.
Anomaly detection and AI features help teams find unusual behavior faster
Fixed thresholds are helpful, but they can miss odd patterns. An app may always spike at 9 a.m., so a static alarm can create noise. CloudWatch anomaly detection learns normal behavior and flags outliers instead.
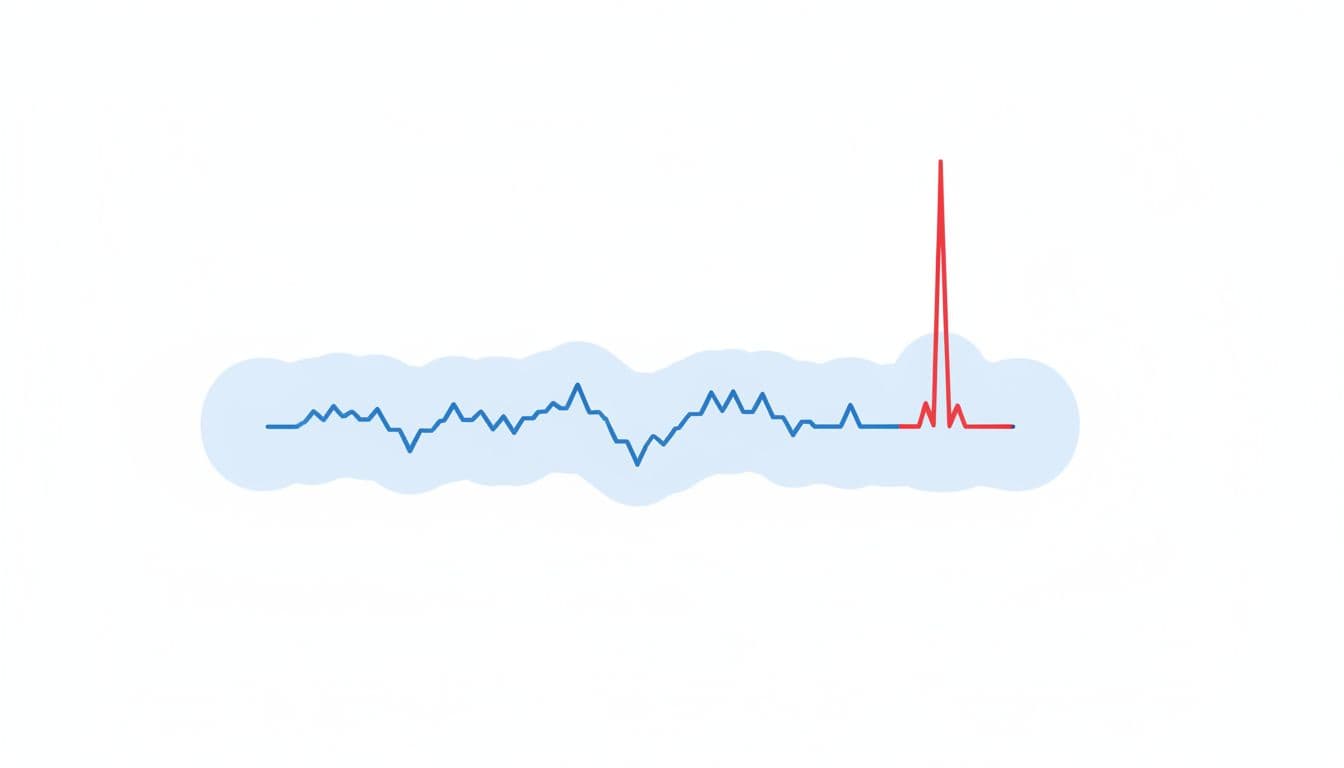
That helps teams catch traffic bursts, latency jumps, or spend-driving changes faster than fixed rules alone. AWS has also expanded tools around application signals and service-level objectives, which makes it easier to watch availability, latency, and error targets together.
Recent updates make monitoring easier across large AWS organizations
One notable March 2026 update lets teams automatically enable EC2 detailed monitoring across an AWS Organization. AWS announced that admins can set rules for existing and new instances, scoped by organization, account, or tag, in its March 2026 product update.
That matters because large companies often miss consistent coverage. When monitoring settings vary by account, teams get blind spots. AWS has also been moving CloudWatch toward cleaner, more centralized telemetry handling since late 2025, which helps reduce duplicate data and messy log pipelines.

We can unlock discounts on 10,000+ tools you already use.
What Amazon CloudWatch costs, and how to use it without overspending
CloudWatch uses pay-as-you-go pricing. The main charges usually come from custom metrics, dashboards, alarms, logs ingested, logs stored, and logs scanned in queries. There’s also a free tier, but fast-growing environments can outgrow it quickly.
The tricky part is that CloudWatch spend often grows quietly. A team adds detailed logs for troubleshooting, then forgets to reduce retention. Another team creates many custom metrics per container or per tenant. A dashboard sprawl follows, and alarm counts rise too. For a good breakdown of these cost patterns, this CloudWatch pricing guide is useful.
CloudWatch is usually cheap when it stays focused. It gets expensive when data collection becomes a habit instead of a plan.
The main CloudWatch charges to watch before they grow quietly
Log ingestion is a common driver because chatty apps generate large volumes fast. Heavy use of Logs Insights can also add up when teams scan broad log ranges over and over. Custom metrics deserve attention too, especially when tags or dimensions multiply the total count.
Detailed monitoring can be worth the cost, but not every resource needs the highest frequency. The same goes for alarms. If every small signal has its own alert, teams pay more and hear less.
Simple ways to keep CloudWatch useful and cost-efficient
Set log retention on purpose. Filter noisy logs before they land. Create custom metrics only when a team will act on them. Review dashboards and alarms every quarter, then remove the ones nobody uses.
Finance teams should pair CloudWatch data with cloud savings options as well. For example, AWS promotional credits for cloud savings can reduce part of the bill, but credits don’t fix waste. Better visibility still matters because unused instances, oversized workloads, and runaway logs can burn through any discount.
CloudWatch works best when teams treat it like both an operations tool and a cost signal.
CloudWatch helps teams understand what is happening in AWS, react faster when trouble starts, and make better calls about resource use. That makes it useful far beyond engineering.
If your AWS environment is growing, treat Amazon CloudWatch as part of your cost-awareness stack, not only your incident stack. The teams that connect performance signals to spend usually make better cloud decisions, sooner.


Get discounts on your team’s favorite apps
Find deals for 10%, 30%, or even 70% off in our discount marketplace.
Check Discounts