






Cost optimization
AWS Cloud Resource Utilization: Lower Spend, Better Performance

Your cloud bill can look fine while a large share of paid capacity sits cold. In AWS, utilization is simply how much of your paid compute, storage, and network capacity is actually being used.
If you’re a CTO, low use shows up as oversized EC2, quiet load balancers, and non-prod stacks left on all weekend. If you’re a CFO, it shows up as spend that drifts up without a matching business reason. Better AWS cloud resource utilization means you buy closer to real demand, so you spend less without hurting service quality.
That starts with plain visibility, then turns into routine action.
What resource utilization means in AWS, and why it changes your cloud bill
In Amazon Web Services, utilization is the match between what you provision and what your workloads consume. When that match is poor, AWS cost rises. When it is tighter, planning improves, cost allocation gets cleaner, and idle resources in AWS become easier to spot.
This table gives you the core terms at a glance.
| Concept | Simple meaning | Why it matters |
|---|---|---|
| Compute use | How hard EC2 or Lambda runs | Oversized compute wastes money |
| Storage use | How much EBS, S3, or Redshift you actively use | Old data and unattached volumes add cloud costs |
| Network use | Traffic through load balancer, NAT, and data transfer | Low traffic can expose stale infrastructure |
| Cost allocation | Tags that map spend to teams and apps | You can assign ownership and fix waste faster |
The takeaway is simple: resource usage patterns drive costs and resource planning.
The main signals you should watch, from CPU to storage to network
No single metric tells the whole story. CPU utilization helps, but you also need memory, disk, network, and service-specific activity. For EC2, the CloudWatch metric named CPUUtilization is often the first signal. For memory, you usually need the CloudWatch Agent. For RDS, connections, IOPS, and free storage matter. For Lambda, duration, errors, and invocation count matter.
Keep an eye on:
- EC2 instance CPU, memory, disk, and network
- EBS volume size, IOPS, throughput, and burst balance
- RDS connections, storage growth, and read/write load
- Load balancer request count and target health
- S3 storage class mix and access patterns
AWS itself recommends right-sizing compute resources based on historical use, not guesswork.
How poor utilization raises AWS cost
Low usage rarely hurts in one dramatic spike. It bleeds through small, repeated waste. You underutilize an EC2 instance, forget an unattached Elastic Block Store volume, or keep a test environment running after the sprint ends. That is how billing and cost management gets messy.
Common waste patterns include:
- Overbuilt EC2 instance types with low CPU and memory demand
- Unused resources such as idle load balancers and old snapshots
- Storage volumes that stay allocated but are not actively used
- Orphaned dev, QA, or disaster-recovery stacks
In 2026, teams want real-time cost control because month-end reports arrive too late.
See how much you can save on your stack
Pick your team’s tools!
Click to select one or more tools.


What’s your company size?
Just click to select.
What’s your business email?
We'll send you calculations right away
The email is flying to your inbox!
Beyond discounts, you may qualify for up to $100K in AWS credits.

The upside and downside of pushing AWS utilization higher
Higher utilization can improve cost optimization, but only to a point. A busy system can be efficient, or it can be one traffic spike away from pain. You need balance.
This side-by-side view helps frame the tradeoff.
| Move | Benefit | Challenge |
|---|---|---|
| Rightsize EC2 | Lower aws cost | Less buffer for spikes |
| Tighten scaling | Fewer idle cores | Bad thresholds can flap |
| Tier storage | Lower cost per GB | Retrieval can cost more |
| Commit with Savings Plans | Compared to On-Demand, discounts can reach 50% to 72% for stable use | Waste locked into commitments |
The best result is not the highest possible utilization. It is the safest useful level.
Where higher utilization helps your business most
For leadership, the wins are plain:
- You maximize existing capacity before buying more
- Forecasting gets better because usage patterns are clearer
- Budgets get cleaner because resource allocation improves
Across 2026 AWS cost playbooks, compute still absorbs about half of spend for many teams. That means EC2 rightsizing, auto scaling group tuning, and better instance allocation usually pay back first.
When chasing higher utilization can backfire
If you pack workloads too tightly, you lose headroom for failover, seasonal demand, or recovery time. That is where a finance win turns into a service risk.
Efficient systems still need headroom for spikes, failover, and growth.
Noisy neighbors in Kubernetes clusters, stressed RDS storage, or aggressive scaling limits can create slower apps and longer incident response.
How to measure utilization the right way in AWS
You need both performance data and cost and usage data. CloudWatch shows what systems do. AWS Cost Explorer and billing reports show what those actions cost. Trusted Advisor adds another layer by flagging waste and low-use assets.

This workflow keeps your monitoring actionable.
Raw metric -> 7, 30, and 90-day trend -> cost and usage data -> owner -> action
Use this operating model.
| Best practice | What you use | Why it works |
|---|---|---|
| Track trends, not one-day spikes | AWS CloudWatch | Shows real utilization trends |
| Pair usage with spend | AWS Cost Explorer | Connects performance to aws cost |
| Review waste signals | AWS Trusted Advisor | Helps identify idle and underused assets |
| Query detailed billing | Cost and Usage Reports with Athena | Supports chargeback and deeper analytics |
The AWS cost optimization pillar also stresses regular review of idle and underutilized resources.
Which AWS metrics give you the clearest view
Start with cloudwatch metrics that map to spend and pressure:
- EC2 CPUUtilization, network in/out, disk reads and writes
- Memory via agent-based detailed monitoring
- RDS connections, read latency, and free storage
- Lambda duration, concurrency, and invocation
- Load balancer request count and target response
A single threshold is weak. Trend lines over 7, 30, and 90 days are stronger because they expose steady slack and recurring peaks.
How CloudWatch and Cost Explorer work better together
When operations and finance work apart, waste lasts longer. Use Amazon CloudWatch to get real-time behavior, then use aws cost explorer to tie those patterns to spend. Add a dashboard, trigger alerts, and review it every month.
If you need more detail, pull cost and usage data into Amazon Athena. That gives you service, tag, and account-level views that finance can use.
Practical ways to improve AWS resource utilization without hurting performance
The best playbook is short: find waste, decide what is safe to change, act, then review results.
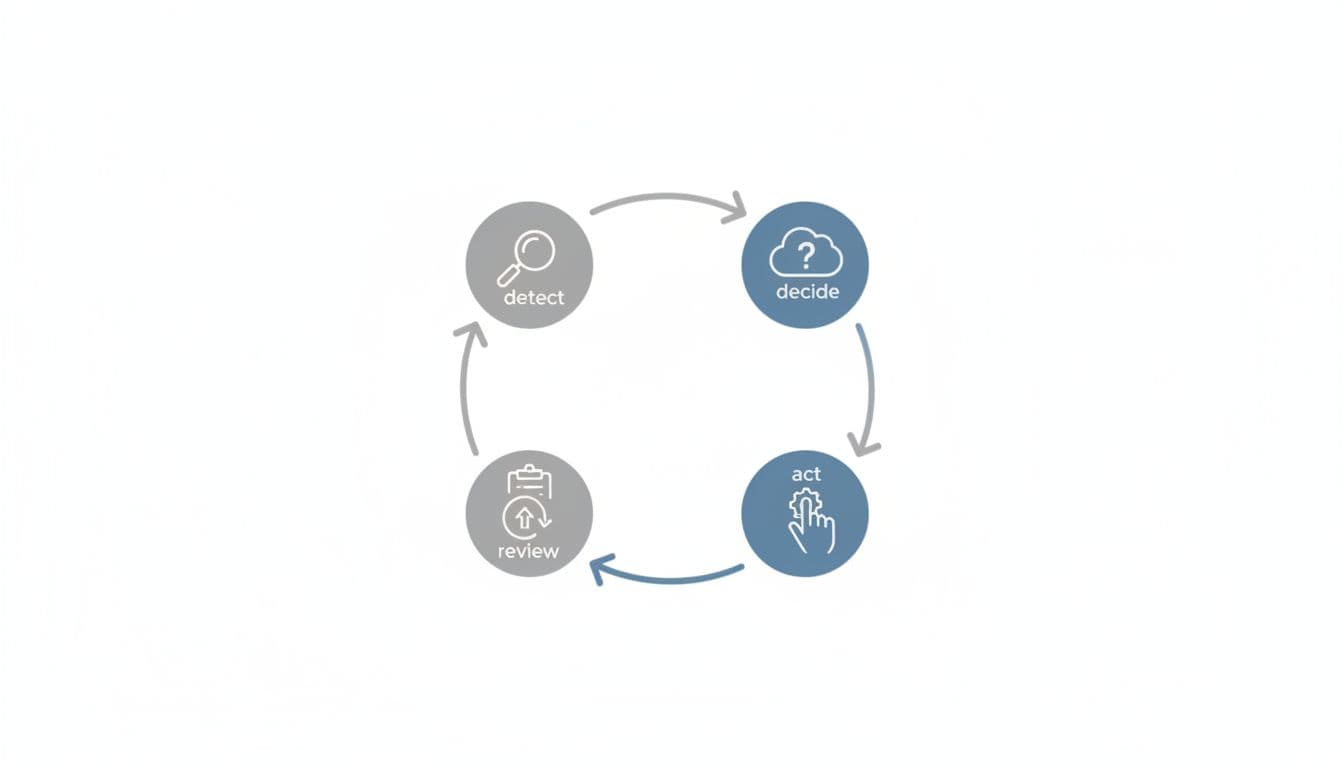
Use this loop every month.
Detect -> decide -> act -> review
The best habits for cutting waste fast
Start with the fastest wins:
- Find idle EC2 and stop or downsize them
- Delete unattached EBS volume assets and old snapshots
- Schedule dev and test shutdowns after hours
- Tune auto scaling group thresholds
- Move cold data into lower-cost S3 tiers
A solid 2026 playbook for compute and storage savings points to the same pattern: delete unused EBS, move gp2 to gp3 where it fits, and clean up stale infrastructure before you buy commitments.
How to build automation that keeps waste from coming back
Manual cleanup fades. Automation sticks. Use Lambda, Systems Manager, or simple scripts that call describe-instances and get-metric-statistics style checks, then route results into approval-based automation workflows.
Good automation usually includes:
- Low-use alarms that trigger alerts
- Scheduled shutdowns for non-prod AWS environments
- Tag checks for ownership and allocation
- IAM guardrails for approval and rollback
That systematic approach saves time and reduces human drift.
Free virtual cards for non-EU residents
Open in 1 working day, issue 100 virtual cards, and get up to 1.25% cashback.
Get a free account
Tools, discounts, and credits that can lower your AWS spend
Your monitoring tool should match your environment, not your wish list.
| Tool | Pricing note | Best fit | Key insight |
|---|---|---|---|
| Amazon CloudWatch | Pay-as-you-go for metrics, logs, dashboards, alarms | AWS-only teams | Native and fast for core metric tracking |
| Datadog | Per-host and data-volume pricing | Multi-cloud teams | Strong cross-platform visibility |
| Dynatrace | Usage-based, often quote-led | Large enterprises | Good AI-assisted root cause analysis |
| Prometheus + Grafana | Open-source, but you pay infra and ops cost | Kubernetes-heavy teams | Flexible and powerful if you have platform skill |
| New Relic | Free tier plus usage charges | Teams that want broad observability | Good mix of APM and infrastructure views |
The best monitoring tool is the one your team will review every week.
Which monitoring tool fits your AWS environment best
Use this quick filter:
- Choose CloudWatch if you are mostly in AWS and want native dashboards.
- Pick Datadog if you run AWS, SaaS apps, and other clouds together.
- Use Prometheus plus Grafana if Kubernetes and containers dominate.
- Consider Dynatrace if you want deep app tracing with AI-driven suggestions.
How AWS credits and marketplace discounts can support cost control
Credits do not fix poor utilization. They do buy time while you clean it up. For startups and eligible companies, get up to $100k in AWS credits through Spendbase. You can also use their discount marketplace option to reduce CloudFront, compute, and storage costs while you improve usage patterns.
Spendbase also has a 2026 guide for AWS credit programs if you want the current options in one place.
One more budgeting rule matters in 2026: clean waste first, then commit steady workloads to discounts.
What real AWS utilization wins look like in the wild
You do not need a grand transformation. Most savings come from boring fixes done on time.
This table shows five common wins.
| Team | Problem | Action | Typical result |
|---|---|---|---|
| Startup | Dev stacks ran 24/7 | Scheduled shutdowns | Lower non-prod compute spend |
| Platform team | EC2 fleet oversized | Rightsized amazon ec2 instances | Better compute efficiency |
| Data team | Old data stayed hot | S3 lifecycle and Redshift cleanup | Storage savings, often 40% to 70% on cold data tiers |
| SaaS team | Quiet load balancer and extra capacity | Removed stale resources, tuned scaling | Lower network and compute waste |
| DevOps team | No shared dashboard | Added alerts and monthly review | Faster idle resource detection |
The pattern repeats across teams.
Examples from startup, platform, and data teams
Three examples show the shape of repeatable savings:
- A startup trims idle dev environments every night, then uses serverless for small internal jobs.
- A platform team rightsizes EC2 after 30-day CPU and memory review, then shifts steady usage into savings plans.
- A data team moves cold logs to cheaper S3 classes, reviews Redshift storage growth, and cuts costs without slowing daily analytics.
What these examples teach you about repeatable savings
The common habits are steady:
- Tag everything that costs money
- Review dashboards every month
- Trigger alerts before waste becomes normal
- Assign an owner to each spend bucket
That is what makes cloud cost optimization stick.

We can unlock discounts on 10,000+ tools you already use.
Conclusion
AWS cloud resource utilization is a business discipline with technical inputs. When you match paid capacity to real demand, you lower spend, improve forecasting, and keep performance steady.
Start with one pass through your AWS data. Review usage patterns, identify idle resources, and set a monthly routine around CloudWatch, Cost Explorer, and ownership tags. Small corrections, repeated on schedule, beat one big cleanup every time.


Get discounts on your team’s favorite apps
Find deals for 10%, 30%, or even 70% off in our discount marketplace.
Check Discounts