






Google BigQuery has become one of the most widely adopted analytics platforms in modern data architectures, and organizations continuously rely on it for numerous data analytics and warehousing use cases. However, as data volumes and query complexity grow, BigQuery costs can scale rapidly if not managed carefully.
To avoid this, we’ll cover the essentials of efficient BigQuery usage – core capabilities, pricing mechanics, common cost drivers, practical optimization strategies, and more.
Key Highlights
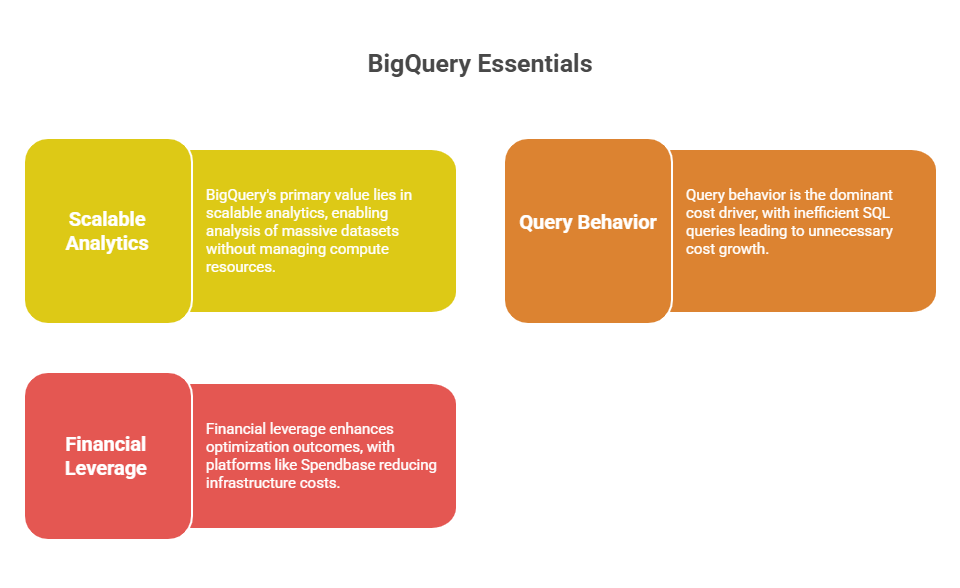
> BigQuery’s primary value lies in scalable analytics. It enables organizations to analyze massive datasets using serverless infrastructure without managing compute resources.
> Query behavior is the dominant cost driver. Inefficient SQL queries, unpartitioned datasets, excessive data scanning, and poorly designed schemas often lead to unnecessary cost growth.
> Financial leverage enhances optimization outcomes. Platforms like Spendbase help organizations reduce infrastructure costs through up to $200,000 in free GCP credits, vendor discounts, strategic FinOps support, and more.
See how much you can save on your stack
Pick your team’s tools!
Click to select one or more tools.


What’s your company size?
Just click to select.
What’s your business email?
We'll send you calculations right away
The email is flying to your inbox!
Beyond discounts, you may qualify for up to $100K in AWS credits.

What Is Google BigQuery
Google BigQuery is a fully managed, serverless data warehouse designed for large-scale analytics. It allows teams to run SQL queries across massive datasets without managing infrastructure.
BigQuery separates storage and compute layers, thus enabling organizations to store petabytes of structured or semi-structured data while executing high-performance queries on demand. Because of this, BigQuery is often used for business intelligence dashboards, real-time analytics, data lake query engines, Machine Learning pipelines, and so on.
Unlike traditional data warehouse workflows, BigQuery operates as a fully managed, serverless platform that automatically scales and executes queries on demand. See key differences in the table below.
BigQuery | Traditional Data Warehouses | |
| Infrastructure management | Fully managed | Requires cluster management |
| Scaling | Automatic | Manual scaling |
| Query execution | Serverless | Compute-bound |
| Storage separation | Yes | Often tightly coupled |
| Cost model | Pay-per-query / capacity | Often tightly coupled |
How BigQuery Works
BigQuery operates on a distributed query execution engine designed to process extremely large datasets with minimal operational overhead. Its architecture is serverless and cloud-native. This means, storage and compute are separated and automatically scaled by Google Cloud infrastructure.
When a query is executed, several coordinated components work together behind the scenes. Let’s review them in more detail.
1. BigQuery scans relevant data from columnar storage
Data in BigQuery is stored in Google’s Colossus distributed storage system, which uses a columnar storage format with compression. This design allows BigQuery to read only the columns required for the query instead of scanning entire tables – as a result, significantly reducing the amount of processed data.
Colossus also handles replication, recovery, and distributed storage management, thus eliminating single points of failure.
2. Compute resources are automatically allocated
BigQuery’s compute layer is powered by Dremel, a large distributed query engine. When a query runs, Dremel dynamically allocates thousands of slots. Most importantly, because BigQuery is serverless, users do not need to provision clusters or manage compute resources. Instead, the system automatically scales based on query complexity and workload demand.
3. Query execution occurs across distributed nodes
A massively parallel processing architecture allows BigQuery to analyze terabytes or even petabytes of data within seconds.
Specifically, at this stage, the query is converted into an execution tree, where multiple workers process different parts of the data in parallel:
- Slots (leaf nodes) perform intensive tasks such as scanning data from storage and executing calculations;
- Mixers (intermediate nodes) aggregate partial results from multiple slots.
4. Data is shuffled and aggregated across the network
During execution, intermediate results may need to be redistributed between nodes. BigQuery uses Google’s Jupiter high-speed network to rapidly move data between compute stages. This shuffle layer ensures that aggregation, joins, and other complex operations can be completed efficiently at scale.
5. Results are aggregated and returned
Once the distributed computation finishes, aggregated results are returned to the user through the BigQuery interface, API, or client tools.
6. Resource orchestration and workload management
Underlying infrastructure components (like Borg, Google’s cluster orchestration system) manage hardware allocation and scheduling for the slots and mixers executing the query. As a result of it, you get efficient resource usage and fair scheduling across multiple users running concurrent queries.
Key Capabilities of Google BigQuery
From our observations across real-world data platforms, organizations rely on BigQuery for several core responsibilities. Let’s dive in.
Large-Scale Data Analytics
In practice, BigQuery performs best when organizations need to analyze very large datasets quickly without managing infrastructure. Its distributed execution engine allows queries to run across thousands of compute resources simultaneously, which makes it possible to analyze billions of rows in seconds.
From our experience working with analytical workloads, the following capabilities make BigQuery particularly effective for large-scale analytics:
> Interactive SQL on large datasets enabling complex queries across terabytes of data
> Columnar storage that scans only required columns
> Massively parallel execution using thousands of compute slots
> BI tool integration with support for Looker, Tableau, Power BI, etc.
> Support for multiple data formats (JSON, Parquet, etc.)
Data Warehousing & Centralized Analytics
Many organizations use BigQuery as the central analytical layer of their data architecture.
In real-world deployments, BigQuery’s capabilities provide several advantages:
- Storage for data consolidated from multiple sources (operational databases, SaaS platforms, application logs, and third-party datasets, etc.)
- Pipeline integration (supporting batch and streaming ingestion)
- Reporting and forecasting – dashboards, analytical models, etc.
- Scalable historical storage for large long-term datasets – reducing historical data storage costs by 50%
- Built-in governance using IAM policies and access controls
Real-Time Analytics
Another area where BigQuery proves useful is near real-time analytics, particularly when integrated with streaming data pipelines. With it, organizations don’t have to wait for batch ETL cycles – they can analyze events shortly after they are generated.
From our experience, typical scenarios where this becomes valuable include:
> Application telemetry analysis
> Event-driven analytics (processing user interactions, transactions, etc.)
> Marketing analytics – for tracking campaign engagement and conversions
> IoT data processing and analysis of continuous sensor streams
> Fraud detection and identification of suspicious transaction patterns
Free virtual cards for non-EU residents
Open in 1 working day, issue 100 virtual cards, and get up to 1.25% cashback.
Get a free account
Machine Learning Integration
One of BigQuery’s strengths is how closely it integrates with Google Cloud’s machine learning ecosystem. Instead of exporting datasets to separate ML environments, teams can train and run models directly where the data already resides.
From a practical perspective, this simplifies the machine learning workflow in several ways:
- Built-in machine learning with BigQuery ML. Data teams can train models (f.e., regression, classification, clustering, forecasting, etc.) directly using SQL.
- Integration with Vertex AI. For more advanced ML pipelines, BigQuery datasets can be used to train models in Vertex AI using frameworks (such as TensorFlow or PyTorch).
- Training on large datasets. Because BigQuery runs on distributed infrastructure, models can be trained on large analytical datasets without provisioning additional compute resources.
- Prediction directly in queries. Models can generate predictions directly within SQL queries, enabling real-time scoring pipelines.
- Feature engineering inside the warehouse. Data preparation and feature transformation can be performed within BigQuery, which means a reduced the need for external preprocessing pipelines.
Top Use Cases for BigQuery
Assessing BigQuery requires more than reviewing its feature list. First and foremost, it’s important to understand how the platform behaves under real analytical workloads that commonly challenge large-scale data processing systems: including how BigQuery reacts when datasets grow rapidly, queries become complex, multiple analytics pipelines operate simultaneously, and so on.
Below, we’ve gathered several observations from hands-on testing across different analytical scenarios.
✅ Case #1: Large-Scale Analytical Workloads
For the first scenario, we examined a data warehouse environment processing large analytical queries across multi-terabyte datasets. The platform supported several internal dashboards, data science workflows, and operational reporting pipelines.
Assessment Highlights | |
| Primary Value | High-performance analytics on massive datasets |
| Query Behavior | Parallel execution across distributed compute |
| Processing Model | Serverless query engine |
| Scalability Benefit | Petabyte-scale analytics without infrastructure management |
| Operational Simplification | No cluster provisioning or scaling |
| Reliability Benefit | Fully managed infrastructure |
| Key Consideration | Inefficient queries increase data scanned and cost |
During testing, several important observations emerged:
> BigQuery consistently maintained high query performance even as datasets scaled into multi-terabyte ranges;
> The serverless execution model allowed compute resources to scale automatically during heavy query loads, avoiding manual cluster management;
> Parallel query execution significantly reduced processing time for large analytical workloads;
> Query efficiency, however, remained strongly dependent on proper schema design, partitioning, and filtering logic.
✅ Case #2: Real-Time Analytics Pipelines
The second scenario we reviewed involved real-time event analytics pipelines, where application telemetry and user behavior data were continuously streamed into BigQuery.
Assessment Highlights | |
| Primary Value | Real-time data analytics |
| Ingestion Model | Streaming inserts |
| Processing Behavior | Near real-time query availability |
| Scaling Mechanism | Automatic compute allocation |
| Operational Benefit | Eliminates dedicated analytics clusters |
| Reliability Benefit | Fully managed ingestion pipeline |
| Key Consideration | Streaming inserts introduce additional costs |
To address environmental challenges, the architecture had to support continuous ingestion, scalable query execution, and efficient management of rapidly growing event datasets. Therefore, our goal was to evaluate BigQuery based on these aspects.
Our testing revealed several highlights:
> Streaming ingestion pipelines were able to process large volumes of real-time data with minimal operational overhead.
> Newly ingested data became queryable almost immediately, enabling near real-time analytics dashboards.
> Concurrent query execution across analytical workloads remained stable even under heavy ingestion loads.
To conclude, during testing BigQuery proved highly effective for real-time analytics workloads – in particular, it offered reliable streaming ingestion and stable query performance at scale. However, streaming costs should be carefully monitored, since there’s a potential high-frequency streaming ingestion becomes a notable cost driver in large-scale analytics environments.
✅ Case #3: Rapidly Growing Data Platforms
Next on, we analyzed a rapidly growing analytics platform, with a use case where datasets expanded continuously as the business scaled.
Assessment Highlights | |
| Primary Value | Seamless scaling of analytical datasets |
| Scale-Up Behavior | Automatic expansion without cluster resizing |
| Data Growth Handling | Petabyte-scale storage support |
| Operational Benefit | No infrastructure migration events |
| Stability Mechanism | Separation of compute and storage |
| Cost Behavior | Query costs scale with data scanned |
| Key Consideration | Unoptimized queries may increase cost significantly |
In our testing, BigQuery’s architecture reduced several risks commonly encountered when scaling data platforms: costly cluster upgrades, performance degradation, scaling disruptions, complex migrations, you name it (this is all largely due to its serverless design and the separation of compute and storage).
Besides, here are several additional observations we’ve encountered during testing:
> Storage expansion occurred seamlessly without requiring cluster resizing or infrastructure upgrades.
> The separation of compute and storage allowed query execution capacity to scale independently of dataset size.
> Query performance remained stable as data volumes increased.
> However, query costs increased proportionally with data scanned, which means query optimization is a must-have in this case.
Suitability Verdict
Besides the above-mentioned cases, BigQuery can be a great fit for organizations that need to analyze large volumes of structured or semi-structured data without managing complex infrastructure.
From our observations, BigQuery can also perform well for near-real-time analytics, interactive dashboards, streaming data analytics, and similar cases – though, in our experience, in such cases, these environments require careful query design and cost monitoring, especially as data volumes and query frequency increase.
Meanwhile, note this: BigQuery is optimized for analytical workloads, not transactional processing. Therefore, it is not suitable for cases that require rapid row-level updates and strict transaction handling: high-frequency transactional systems, operational databases, latency-sensitive OLTP applications, etc.
BigQuery Suitability Verdict | ||
| Highly Suitable | Conditionally Suitable | Not Recommended |
| Business intelligence analytics | Near-real-time analytics | High-frequency transactional workloads |
| Data warehouse architectures | Interactive dashboards | Operational databases |
| Marketing and product analytics | Streaming data analytics | Latency-sensitive OLTP systems |
| Log and event analysis | Write-heavy operational systems | |
| Machine learning data pipelines | ||
BigQuery Pricing Overview
BigQuery pricing is primarily based on two core components: storage and query processing. The platform follows a pay-as-you-go model, meaning organizations only pay for the resources they actually use rather than maintaining dedicated infrastructure.

In particular:
> Storage is divided into 2 main tiers, each priced separately: 1) active (for tables that have been modified within the last 90 days, 2) long-term – automatically discounted and does not requiring manual configuration. To better understand the differences between them, check out the official guide.
> Query processing is based on the amount of data scanned during execution and includes two models: 1) on-demand pricing – billing based on data processed; 2) capacity-based pricing – reserving compute slots for predictable workloads. Learn how to create custom query quotas here.
With capacity pricing, organizations configure slot reservations, which allocate pools of compute resources for specific workloads. Reservations help isolate workloads and manage compute capacity across teams or projects. This model is billed in slot-hours, and BigQuery editions support pay-as-you-go usage, autoscaling reservations, or discounted one- and three-year slot commitments.
Technically, storage pricing can also depend on the storage billing model, which may use logical (uncompressed) or physical (compressed) bytes.
Besides, additional charges may occur depending on how data is ingested or transferred:
- Streaming ingestion – inserting data into BigQuery in real time using the streaming API may incur additional charges.
- Data transfer and network usage – moving data between regions or exporting data outside Google Cloud can generate network egress costs.
- Data processing services – if pipelines use services such as Dataflow or Dataproc, those services are billed separately.
BigQuery Pricing Breakdown | ||
| Cost Area | Behavior | Pricing details |
| Storage | Data stored in BigQuery tables | $0.02 per GB/month (active storage) |
| Long-term storage | Automatically applied after 90 days | $0.01 per GB/month |
| Query processing | Data scanned during queries | $5 per TB processed |
| Streaming inserts | Real-time data ingestion | $0.01 per 200 MB |
| Data transfer | Cross-region transfers | Varies by region |
From our experience, the best way to understand BigQuery pricing is to look at a typical analytical workload scenario.
To do so, let’s review an example where a company stores several terabytes of analytical data, runs regular queries for dashboards and reporting, ingests some streaming data, and occasionally transfers data between regions.
The hypothetical example below shows how monthly costs can accumulate – however, note that actual spending depends on various real-life factors: query patterns, data growth, ingestion frequency, the pricing model used, and more.
Realistic BigQuery Monthly Cost Example | ||
| Pricing Dimension | Scenario Usage | Estimated Cost |
| Storage | 3 TB dataset | $60 |
| Query processing | 60 TB scanned per month | $300 |
| Streaming ingestion | 1 TB streamed | $50 |
| Data transfer | Inter-region transfer | $40 |
Total Estimated Cost | $450/month | |
Scaling BigQuery: What Drives Costs
BigQuery’s architecture enables it to analyze massive datasets within seconds. However, here’s a twist: query execution costs depend heavily on how much data is scanned during execution. This is precisely why special cost optimization techniques are essential for cost optimization.
Based on our observations, BigQuery costs typically scale with:
- Query complexity – inefficient SQL scans more data;
- Dataset size – larger tables increase scan volume;
- Query frequency – dashboards and pipelines increase usage;
- Streaming ingestion – real-time pipelines generate additional cost;
- Data transfer – cross-region analytics pipelines cost more in the end.
| Typical Drivers of BigQuery Cost Escalation | ||
| Cost Driver | Impact | Mitigation Strategy |
| Full table scans | High query costs | Use partitioning |
| Inefficient SQL queries | Excessive data scanning | Query only required columns |
| High-frequency dashboards | Continuous query execution | Cache results |
| Large unstructured datasets | High storage cost | Archive inactive data |
| Unoptimized ingestion pipelines | Data duplication | Implement ETL validation |
BigQuery Cost Optimization Best Practices
In our experience, BigQuery can be extremely cost-efficient when queries and data architecture are designed with cost control in mind. See the best practices below to explore how to achieve that.
| Quick Wins for BigQuery Cost Optimization | |||
| Strategy | Effort | Savings | Impact Speed |
| Use partitioned tables | Low | High | Immediate |
| Avoid SELECT * queries | Very low | High | Immediate |
| Enable clustering | Medium | Medium | Fast |
| Cache query results | Low | Medium | Immediate |
| Archive inactive datasets | Low | High | Short-term |
For quick wins in BigQuery optimization, follow these practices:
- Use partitioned tables – identify large tables that are queried frequently, partition them by time or ingestion date, ensure queries include partition filters, reduce the amount of scanned data and query costs;
- Avoid SELECT* queries – review queries for unnecessary column retrieval, select only required fields, reduce processed data during execution;
- Enable clustering – identify tables frequently filtered by specific columns, cluster them by common query fields such as user IDs or timestamps, improve data locality, reduce scanned data during queries;
- Cache query results – use BigQuery’s query caching for repeated workloads, reuse results when underlying data hasn’t changed, cut compute consumption for dashboards and recurring reports;
- Archive inactive datasets – analyze dataset usage patterns, identify rarely accessed historical data, move it to archival storage or external storage solutions.
| Advanced Optimization Strategies | |||
| Strategy | Effort | Savings | Impact Speed |
| Query pattern optimization | Medium | High | Medium-term |
| Data architecture redesign | High | Very high | Long-term |
| Storage lifecycle automation | Medium | High | Medium-term |
| BI query optimization | Medium | High | Medium-term |
To ensure long-term BigQuery cost efficiency, do the following:
- Query pattern optimization – analyze frequently executed queries, identify inefficient joins or repeated scans of large tables, restructure queries to filter data earlier, reduce processed data volumes;
- Data architecture redesign – review the structure of datasets and tables, separate raw, processed, and analytical layers, introduce partitioning and clustering where appropriate, design schemas optimized for analytical workloads;
- Storage lifecycle automation – analyze dataset access patterns, define lifecycle policies based on data age or usage frequency, automatically move inactive data to long-term storage, remove temporary or obsolete datasets;
- BI query optimization – review queries generated by BI tools and dashboards, optimize aggregations and filters, reduce unnecessary refresh frequency, ensure dashboards query only the required datasets and partitions.
Getting Started With BigQuery
From our experience of working with BigQuery, the setup itself is simple to enable – however, designing an efficient analytics architecture typically requires thoughtful planning. To ensure an efficient setup, follow the guidelines that we’ve compiled below (or explore the guides in the official documentation).
Step 1: Define Data Architecture
Before creating datasets in BigQuery, it is important to define the overall data architecture. Early design decisions determine how efficiently queries run and how predictable the costs will be as data volumes grow.
Key factors to determine include:
- Data ingestion sources. Identify where the data will originate from – operational databases / application logs / event streams / etc.
Why it matters: This will help you determine what the pipeline will rely on – batch ingestion, streaming pipelines, or scheduled data transfers.
- Dataset structure. Define how datasets and tables will be organized, including: 1) naming conventions, 2) schema structure, 3) how raw, staging, and curated datasets will be separated.
Why it matters: A well-designed dataset hierarchy improves governance, + makes analytical workflows easier to manage.
- Query patterns. Analyze how the data will be queried: through frequent aggregations or ad-hoc queries. This way, you can design tables that support efficient filtering.
- Access frequency. Determine how often different datasets will be accessed. Doing so, you can plan optimization strategies accordingly.
Example: Data Architecture Planning Table | ||||
| Data Domain / Dataset | Data Ingestion Sources | Dataset Structure | Query Patterns | Access Frequency |
Customer analytics | > CRM > Product events > Marketing platforms | Raw → staging → curated analytics tables | Cohort, retention, segmentation queries | High |
| Application logs | > App servers > API gateways > Monitoring tools | Raw logs (date-partitioned) → processed events | Timestamp filtering, error analysis | Medium |
| Sales & revenue | > ERP > Payment platforms > Billing systems | Raw transactions → financial reporting tables | Revenue aggregation, finance dashboards | High |
| Marketing performance | > Ad platforms > Email tools > Web analytics | Raw campaign data → performance dataset | Campaign comparison, attribution | Medium |
| IoT / telemetry data | > IoT devices > Sensor gateways > Event streams | Streaming ingestion → partitioned telemetry tables | Time-series analysis, anomaly detection | High |
Step 2: Structure Datasets Efficiently
Schema design is one of the most important factors affecting BigQuery performance and cost. Because query pricing depends on the amount of data scanned, structuring datasets properly helps ensure queries read only the necessary data.
Recommended practices include:
- Split large tables by a column (f.e., date, timestamp, etc.);
- Implement clustering – organize data within partitions by frequently filtered columns;
- Avoid overly complex schemas;
- Separate raw and processed datasets.
Example: Dataset Structuring Plan | |||
| Dataset / Table | Partitioning Strategy | Clustering Columns | Schema Notes |
| events_raw | Partition by event_date | None | Semi-structured ingestion schema |
| events_clean | Partition by event_date | user_id, event_type | Cleaned, normalized schema |
| sales_transactions | Partition by transaction_date | customer_id, region | Structured transactional schema |
| marketing_campaigns | Partition by campaign_date | channel, campaign_id | Structured marketing dataset |
| iot_metrics | Partition by timestamp | device_id, location | Time-series schema optimized for analytics |
Step 4: Monitor Query Behavior
Query design plays a critical role in BigQuery cost management. Make sure you monitor query behavior and continuously optimize it.
Key metrics to track include:
- Query execution frequency: number of runs per query, scheduled query frequency, dashboard refresh frequency.
- Data scanned per query: bytes processed, tables scanned, partitions scanned, columns scanned.
- Slot usage and concurrency: slots used per query, average slot utilization, concurrent query count, queued queries.
- Dataset growth: dataset size, table size growth, partition growth, storage consumption over time.

We can unlock discounts on 10,000+ tools you already use.
How Spendbase Helps Reduce BigQuery and Cloud Infrastructure Costs
From our experience, companies that use BigQuery efficiently pay close attention to both performance and cloud spending. In the latter case, Spendbase becomes a game-changer for many.
Spendbase helps organizations secure cloud credits across major cloud providers: Google Cloud, AWS, and Azure. Altogether, companies can unlock up to $300,000 in credits – which can significantly reduce the cost of running analytics platforms, data pipelines, cloud storage, to name a few.

For GCP specifically, Spendbase helps companies secure:
- Up to $25K in credits for software startups;
- Up to $200K for Seed–Series A companies;
- CUDs audit (resource-based and spend-based discounts).
Additionally, beyond credits, Spendbase also helps organizations access vendor discounts, SaaS cost optimization, and FinOps guidance. This way, it provides teams with a full suite of solutions and services to maintain efficient cloud spending while continuing to scale their data infrastructure.


Get discounts on your team’s favorite apps
Find deals for 10%, 30%, or even 70% off in our discount marketplace.
Check Discounts