






Open Source Cloud Cost Optimization Tools (2026): 10 Top Picks for AWS, GCP, and Kubernetes

Cloud bills tend to grow exponentially once your usage scales. If you’re running on AWS, Azure, GCP, or all three, it’s easy to lose track of what you’re paying for and why.
To solve this, this article provides an expert, hands-on assessment of major open source contenders for cost optimization: their pros, limitations, major use cases, side-by-side comparisons, Kubernetes monitoring best practices, and more – in short, everything to help you make the right choice.
Key Takeaways
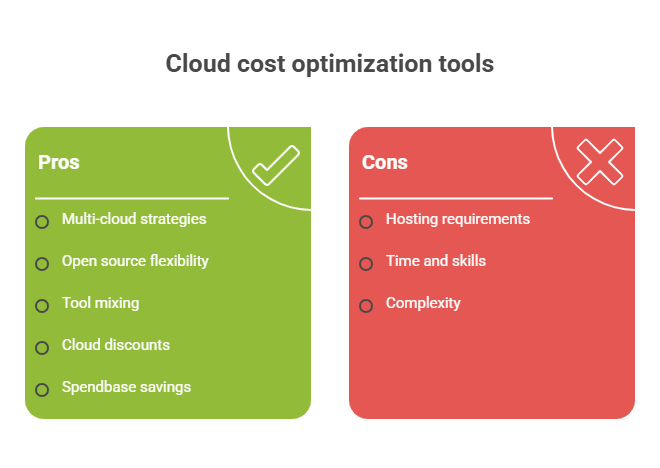
> If you operate across multiple clouds, a structured multi-cloud cost optimization strategies can help you avoid fighting several pricing models at once.
> Open source usually means you host and operate it, so time and skills matter.
> Mixing cloud tools is common: for example, using one for Kubernetes allocation, another for Terraform cost estimates, and a third for autoscaling.
> Cloud cost management discounts can be a simple and efficient path to reduce spend automatically at the pricing level without having to switch to new tools.
> If you look for cost optimization without having to maintain additional infrastructure, Spendbase cloud savings is a go-to path for you. Expect less ops overhead, streamlined time to savings, precise spend visibility, and stronger spend guardrails across cloud and SaaS.
How To Choose The Right Cloud Optimization Tool: Criteria and Considerations
Every tool in this post can help with cloud cost optimization, but they solve different parts of the problem. Therefore, before you opt for any solution, ask these 3 questions: 1) What does it help you see?, 2) How difficult is it to run?, 3) Does its output actually change decisions?.
To ensure a thorough review, we applied a structured evaluation approach based on the criteria below – and whenever you’re choosing solutions yourself, we recommend doing the same.
Open Source Cloud Cost Optimization Tools: Evaluation Checklist | |
| Visibility & allocation | |
| ✅ Costs can be broken down by cluster, service, team, etc. ✅ Allocation logic is clearly defined as either rule-based or inferred ✅ Shared costs are handled in a transparent, explainable way | |
| Actionability | |
| ✅ Concrete actions are suggested (rightsizing, cleanup, scheduling, etc.) ✅ Recommendations are prioritized based on potential impact ✅ Estimated savings are clearly communicated | |
| Setup & maintenance | |
| ✅ Data reliability can be reached quickly after installation ✅ Minimal manual tuning is required to keep the tool accurate ✅ Ongoing operational overhead is clearly understood and manageable | |
| Integrations | |
| ✅ Essential integrations are supported (CI/CD pipelines, Slack, dashboards) ✅ Cost data can be exported via APIs or files ✅ The tool fits into existing FinOps workflows | |
| Coverage | |
| ✅ The tool covers full cloud account (vs Kubernetes workloads only) ✅ Multi-cloud environments are supported ✅ Pre-deployment visibility is provided for IaC tools (Terraform) | |
| Governance controls | |
| ✅ Policy-based guardrails are supported ✅ The tool can block actions or alert teams before costs accrue ✅ Both preventive and reactive controls are available | |
| Maturity signals | |
| ✅ Documentation is clear, complete, and kept up to date ✅ The project shows a consistent release cadence and a visible roadmap ✅ The community is responsive to issues and pull requests |

We can unlock discounts on 10,000+ tools you already use.
Top Cloud Cost Optimization Tools: Overview & Assessment
In any assessment, the fact is clear: there is no universal “best” cloud cost optimization tool. Some of the top cloud expense management tools excel at allocation, others at rightsizing, automation, or prevention. The real advantage comes from knowing what role each tool plays in your cost ecosystem.
If your environment spans multiple providers, it’s worth grounding your approach in proven multi-cloud cost optimization strategies.
Cloud Cost Optimization: Essentials and Tools | |
| Strategy | Tool |
| Getting visibility into spend and usage | Spendbase, OpenCost, Kubecost (open source core), Komiser, Prometheus + Grafana, OptScale |
| Allocating costs to teams and apps | OpenCost, Kubecost (open source core), Prometheus + Grafana, OptScale |
| Rightsizing resources | Kubernetes VPA, StormForge, AWS Compute Optimizer, GCP Recommender API |
| Scheduling workloads so they don’t run 24/7 | Kube-Downscaler, Cluster Autoscaler |
| Adding guardrails that prevent waste before it happens | Cloud Custodian, Infracost, AWS Compute Optimizer (with wrappers), GCP Recommender API |
Kubecost
Best fit for: Teams that want a lightweight Kubernetes cost layer with strong visibility & allocation
Kubecost’s primary focus (and, based on our evaluation, its core strength) is Kubernetes cost monitoring and allocation. By making shared and idle costs explicit, it helps engineering and platform teams understand cost drivers and support practical showback or chargeback as environments scale.
| Area | Rating | Highlights |
| Cost granularity | 5/5 | Allocation down to namespaces, workloads, pods, nodes, and clusters |
| Shared & idle costs | 4/5 | Explicit visibility into shared infrastructure and idle capacity |
| Engineering alignment | 5/5 | Costs mapped to Kubernetes objects that engineers already manage |
| Day-to-day usability | 4/5 | Reporting built for continuous use, not one-off audits |
| Time-to-value | 4/5 | Useful insights available quickly after installation |
| Scale readiness | 4/5 | Designed to handle multi-cluster growth and modern workloads (including GPUs) |
| FinOps fit | 4/5 | Works well as the Kubernetes layer within broader FinOps programs |
Main limitation | More “platform” to operate, some features gated, can get heavy at scale |
Kubercost Assessment Highlights
#1. Accuracy of shared cost handling
One of the first things we looked at was how Kubecost handles shared and cluster-level costs. Above all, Kubercost helps keep costs readable at scale (by clearly attributing shared expenses: ingress, observability, system workloads, you name it).
In particular, it does a great job with node- and cluster-level views, which help separate application waste from platform overhead. In practice, this makes it easier to see whether a cluster is expensive because nodes are oversized or because a small number of workloads are over-requesting resources and forcing larger node pools.
Other aspects that stood out to us in the area of cost handling:
- Attribution to Kubernetes-native objects: namespaces, workloads, nodes, clusters;
- Workload-level breakdown by deployments, daemonsets, statefulsets;
- Separation of application-driven costs vs. platform overhead;
- Stable and readable allocation as clusters grow;
- Good visibility into idle capacity.
#2. Reporting usability (idle spend and shared overhead)
From our hands-on testing, Kubecost is well-suited for everyday decision-making. What’s highly valuable is that it helps move quickly from high-level cluster spend to clear, workload-level explanations. Besides, other useful usability-centered capabilities are:
- Views aligned with how teams ship software;
- Namespace- and workload-level explanations (f.e., “this deployment caused the overrun”);
- Fast answers to cost spikes;
- Visibility into idle spend and over-requested CPU/memory;
- Ability to see impact after deployments or autoscaling changes;
- Support for showback and chargeback.
#3. Overhead
Kubecost has relatively low operational overhead and reaches time-to-value quickly after installation. Additionally, recent performance and scalability improvements focused on keeping query latency and maintenance manageable as clusters grow.
Kubecost outperforms competitors in ways that help reduce operational overhead in several ways. Here’s how:
→ Usable allocation views available early in setup, supporting a strong day-2 experience (not just a one-time audit);
→ Faster analytics queries;
→ Easier and more productive conversations with engineering teams;
→ Scales with cluster sprawl;
→ Reduced reliance on heavyweight metrics setups in some deployments.
Overall, Kubecost feels like a practical solution for teams managing real-world Kubernetes environments. For a practical walkthrough, the Kubecost setup and usage guide is a solid reference.
| Kubernetes Cost Allocation Dimensions | |
| Cost dimension | What it breaks down |
| Namespaces & labels | • Teams• Environments• Products |
| Workloads | • Deployments• DaemonSets• StatefulSets |
| Nodes & clusters | • Individual nodes• Clusters |
| Services | • Kubernetes services |
| Controllers | • ReplicaSets• Jobs• CronJobs |
| Storage assets | • Persistent Volumes (PVs)• Persistent Volume Claims (PVCs) |
| Cloud scope | • Cloud accounts / projects• Regions• Availability zones |
| Cost types | • Compute• Storage• Network |
| Idle & shared costs | • Idle resources• Shared cluster overhead |
| Time | • Hourly trends• Daily trends• Monthly trends |
| Custom allocations | • Allocation rules• Shared cost distribution models |
Another useful tip: if you run Kubernetes management platforms, vendor pricing programs (f.e, Rancher open-source Kubernetes discount) can help reduce overhead.
OpenCost
Best fit for: Teams that want a lightweight & flexible K8s cost layer
As the OpenCost project site highlights, OpenCost focuses on Kubernetes cost monitoring and allocation. In our experience, it works best as the plumbing layer for vendor-neutral, near-real-time cost data – something teams can confidently feed into their own dashboards, alerts, FinOps workflows, and more.
That’s what makes OpenCost a strong starting point for us: when transparent, engineer-trusted allocation logic is needed, but committing to a heavyweight platform too early doesn’t feel right.
| Area | Rating | Highlights |
| Cost granularity | 5/5 | Allocation across clusters, nodes, namespaces, pods, and workloads |
| Vendor neutrality | 5/5 | Consistent allocation across EKS, GKE, on-prem, and hybrid setups |
| Shared & idle costs | 4/5 | Makes shared overhead and idle capacity visible for custom allocation |
| Real-time visibility | 4/5 | Near–real-time views for linking cost spikes to cluster activity |
| Engineering integration | 5/5 | Cost data exposed via APIs and Prometheus |
| Flexibility | 5/5 | Acts as a reusable cost data service rather than a fixed UI |
| Ease of adoption | 4/5 | Trusted allocation logic, but reporting requires extra setup |
| FinOps foundation | 4/5 | Strong open source base that pairs well with higher-level tools |
Main limitation | Raw data layer, not a complete workflow UI |
OpenCost Assessment Highlights
#1. Allocation granularity
What we liked most is how OpenCost breaks Kubernetes costs down to engineer-relevant objects, while also keeping allocations easy to understand. Another great benefit (especially for teams that operate mixed environments) is OpenCost’s vendor-neutral design, which ensures the same allocation logic for all cases – across EKS, GKE, and on-prem clusters.
In practice, this includes:
- Cost breakdowns at the cluster and node levels;
- Namespace- and label-based allocation aligned with teams, products, environments;
- Pod- and workload-level visibility to trace cost spikes to specific deployment changes;
- Explicit handling of shared infrastructure costs that lack a single owner.
If community momentum matters to you, OpenCost’s direction is also easy to validate: you can check out the OpenCost CNCF project update for 2026 for more details.
#2. Real-time reporting: catch waste before the invoice
Another useful benefit: OpenCost’s near-real-time cost updates allow teams to investigate spend as it happens, not after the invoice. This, in turn, has proved to:
- Visibility into idle capacity caused by padded requests or conservative autoscaling;
- Clear exposure of shared costs (ingress, observability, system workloads, etc.);
- Faster correlation between spend spikes and deployments or short-lived workloads.
#3. Flexible export options
OpenCost’s other major strength is how well it fits into existing engineering workflows. It’s designed to act as a reusable cost data layer rather than a standalone reporting tool. Because of that, it integrates cleanly into existing engineering and FinOps.
Key integration points you can rely on:
- API access to cost allocation data for internal dashboards and FinOps reporting;
- Metric export to Prometheus for side-by-side cost and usage graphs in Grafana;
- Standardized allocation logic across teams, even when visualization differs;
- Easy pairing with tools for workflows, governance, or automation.
Infracost
Best for: catching spend before you deploy
Infracost is built for one specific moment that’s easy to overlook: the time before you ship infrastructure. This way, engineers get cost estimates directly from Infrastructure as Code (most commonly Terraform), before a change happens.
InfraCost shines when you’re making choices like:
- instance families and sizes;
- managed database classes and storage settings;
- region changes (where pricing can vary);
- scaling parameters and counts that quietly multiply the cost.
By helping you catch those choices while they’re still easy to undo, InfraCost leads to fewer surprises, fewer rollbacks, and more intentional infrastructure decisions, to name a few benefits. (For a practical walkthrough, explore How to Use Infracost for IaC Cost Estimation).
| Area | Rating | Highlights |
| Pre-deploy focus | 5/5 | Surfaces cost impact during planning and code review, not after billing data arrives |
| PR workflow | 5/5 | Shows clear cost diffs in pull requests (“this change adds $Y/month” |
| Engineering adoption | 5/5 | Integrates into CLI, CI, and PRs without adding process overhead |
| Cost clarity | 4/5 | Makes expensive defaults, sizing choices, and region differences visible early |
| Speed & feedback | 4/5 | Lightweight and fast, usable locally before opening a PR |
| Consistency | 4/5 | Highlights how small changes multiply across environments and regions |
| FinOps alignment | 4/5 | Supports shift-left cost awareness without turning reviews into policing |
| Scope limits | 3/5 | Not designed to explain post-deploy spend or billing anomalies |
Main limitation | Pre-deploy only, doesn’t track actual runtime spend |
InfraCost Assessment Highlights
#1. Cost diffs ensuring more transparent PR comments
InfraCost is built around the logic that cost feedback should arrive while infrastructure changes are still easy to undo. This PR-first approach encourages clearer conversations and prevents expensive defaults from slipping into production unnoticed.
From our testing, core strengths include:
- Automated pull request comments showing change-based cost diffs (“this change adds $X per month”);
- Clear comparison between before-and-after plans;
- Visibility into how changes multiply across environments (dev, staging, prod.
#2. Provider coverage
From what we pointed out during evaluation, InfraCost supports early cost estimation by mapping Infrastructure as Code plans (most commonly Terraform) to known cloud pricing models. This is beneficial for helping teams understand cost implications (before resources are provisioned).
What stood out for us:
- Cost estimation for common cloud resources (compute instances, managed databases, storage, regions, etc.);
- Consistent estimation across multiple environments and modules within the same repository;
- Open source coverage that can be validated and extended through the project’s public repository.
Besides, its strength lies in catching high-impact choices before they reach production. Engineers can sanity-check a branch before opening a PR, which cuts down on review churn. Here’s a simple way to think about where it sits in your process:
Stage | Typical question | Infracost’s advantage |
| Before merge | “How much will this change add?” | Shows cost diffs in PRs |
| Before deploy | “Did we pick the right size and region?” | Makes the expensive config obvious |
| After deploy | “Why did the bill spike?” | Not its main job (use billing tools) |
Also, note this: If you’re pairing “before deploy” estimates with broader cloud cost work, it also complements provider-side cost management. For AWS-heavy teams, it’s worth aligning estimates with your broader AWS cost management strategies.
#3. Baseline accuracy
Infracost focuses on accuracy at the decision point. In doing so, it uses IaC plans as the source of truth (not, like in traditional scenarios, delayed billing exports or usage telemetry). This way, it’s particularly effective for frequent deployers who need fast, reliable signals during stages like planning and review.
This baseline accuracy is supported by:
- Lightweight local execution for quick sanity checks before opening a pull request;
- Early detection of cost drivers (scaling parameters, counts, tier upgrades, etc.);
- Change-based estimates + predictable estimation behavior;
- Infracost open source repository with documented CLI, integrations, supported Terraform resources, etc.
Cluster Autoscaler
Best for: reliable node scaling that cuts waste
If you’ve ever stared at Pending pods and thought, “We have money, why can’t this run?”, Cluster Autoscaler is the practical answer.
In our experience, Kubernetes waste often comes from being sized for peaks while paying for quiet periods. Cluster Autoscaler tackles the node side of that problem by adding nodes when pods can’t schedule and removing them when capacity is no longer needed.
For that reason, we see Cluster Autoscaler as one of the cleanest open-source wins for Kubernetes cost control, since it directly adjusts the cost driver that matters most.
| Area | Rating | Highlights |
| Cost impact | 5/5 | Cuts idle node spend by scaling down excess capacity after demand drops |
| Reliability | 5/5 | Scales up nodes when pods are Pending due to real CPU or memory pressure |
| Alignment with K8s mechanics | 5/5 | Operates on actual scheduling signals and fits cleanly with node groups and managed pools |
| Scale-down efficiency | 4/5 | Safely drains and removes underutilized nodes to reduce steady-state headroom |
| Engineering workflow fit | 5/5 | Works alongside HPA, forming a clear pod-scale / node-scale responsibility split |
| Operational effort | 4/5 | Easy to install, but meaningful savings depend on correct tuning and realistic requests |
Risk & control | 3/5 | Can save or waste money depending on configuration; requires guardrails (PDBs, requests, limits) |
| FinOps relevance | 4/5 | Acts as an infrastructure-layer cost control, preventing waste before it appears on the bill |
Main limitation | Doesn’t rightsize pods, depends on good requests and scheduling |
Assessment Highlights
#1. Scale-up reliability
Cluster Autoscaler is designed to respond to real scheduling pressure, ensuring pods are placed when clusters run out of capacity. By scaling node groups only when pods are Pending due to CPU or memory constraints, it avoids speculative overprovisioning + remains dependable under spiky or unpredictable workloads.
Another aspects that set Cluster Autoscaler apart:
- It reacts to real scheduling pressure, not just averages. If a pod is Pending due to CPU or memory constraints, it’s a concrete signal.
- It fits how clusters are actually operated. You define node groups (or managed node pools), and then it scales within those guardrails.
- It plays well with Horizontal Pod Autoscaler (HPA). HPA adds pods, Cluster Autoscaler adds nodes when those new pods need space. Together, they form a complete feedback loop.
See How Cluster Autoscaler Works and Best Practices for a deeper dive.
#2. Scale-down efficiency (reducing idle nodes)
When paired with realistic pod requests, scale-down becomes one of the most direct ways to reduce infrastructure spend without sacrificing reliability.
Cluster Autoscaler targets the most common waste pattern: idle nodes that linger after demand drops. Here’s how:
- Safely identifies and removes underutilized nodes;
- Gradually consolidates workloads to improve bin-packing over time;
- Reduces steady-state headroom during low-traffic periods;
- Automates node pool resizing instead of manual intervention;
- Drains pods according to disruption rules and terminates nodes once excess capacity is no longer needed.
#3. Cost impact and control
There’s one more important aspect to consider. Although it is not a FinOps dashboard, Cluster Autoscaler directly influences the largest Kubernetes cost driver: node count. This, in turn, leads to the following cost-control benefits:
- Lower idle capacity spend after traffic bursts;
- Fewer performance cliffs caused by saturated nodes;
- Clear separation of responsibilities between pod scaling (HPA) and node scaling;
- Reduced tendency to oversize clusters for worst-case scenarios.
Meantime, be cautious: Cluster Autoscaler can save money or burn money – ultimately, it depends on configuration and workload behavior. Unrealistic requests, aggressive scale-up, or too many node groups can cause churn. To avoid the pitfalls, check out the Cluster Autoscaler cost optimization guide.
Kubernetes Vertical Pod Autoscaler (VPA)
Best for: rightsizing pod requests with less guesswork
Based on hands-on testing and analysis of Kubecost’s VPA guide by example, it’s proven that VPA earns its value quietly by watching real usage over time. At its core, VPA is closest to an auto-mechanic for resource settings: it listens, measures, and then suggests adjustments.
Under the hood, VPA uses three core components:
- Recommender. Observes CPU and memory usage over time and produces target request values.
- Admission Controller. Injects those values into new pods at creation time.
- Updater. It can evict pods so they restart with new requests when you allow automatic updates.
Together, this enables VPA to learn from real usage and adjust resource requests automatically. Besides, when paired with allocation tooling (like OpenCost or Kubecost) and node autoscaling, it creates a feedback loop that’s far easier to manage than manual rightsizing spreadsheets.
As of 2026, VPA is widely adopted and stable, but changes often require pod restarts. Since this is usually acceptable for stateless services, teams commonly start in recommendation mode. To learn more, see Flexera’s VPA pros and cons guide and cloud cost optimization best practices.
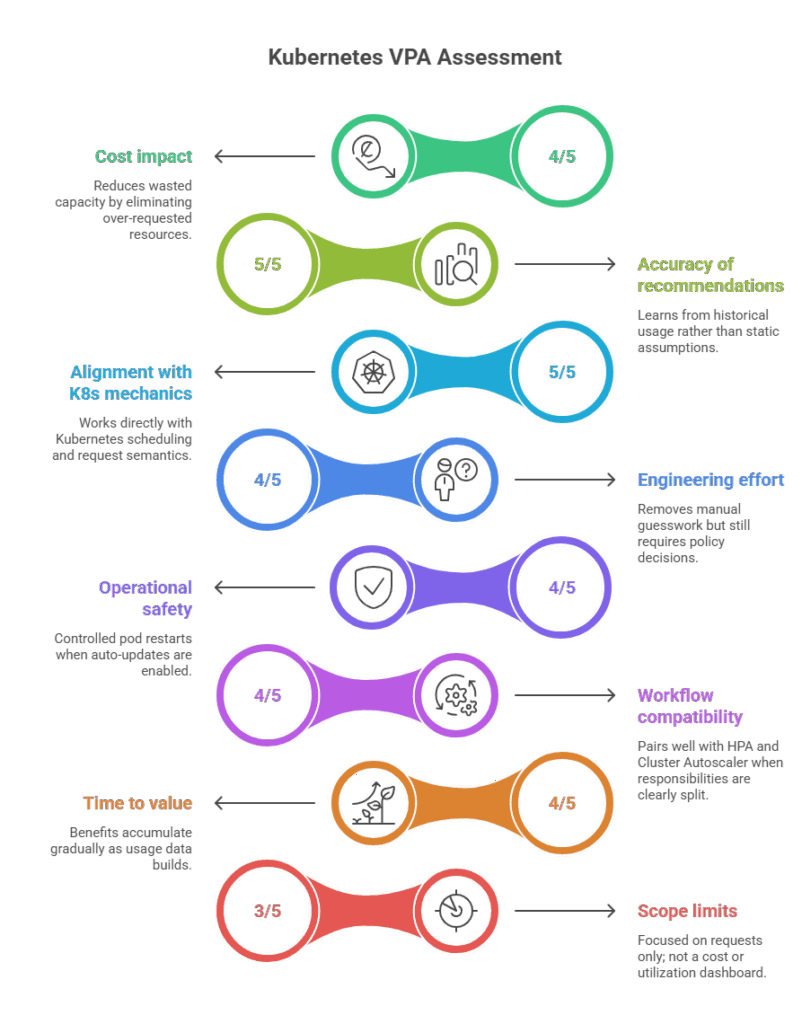
| Area | Rating | Highlights |
| Cost impact | 4/5 | Reduces wasted capacity by eliminating over-requested resources |
| Accuracy of recommendations | 5/5 | Learns from historical usage rather than static assumptions |
| Alignment with K8s mechanics | 5/5 | Works directly with Kubernetes scheduling and request semantics |
| Engineering effort | 4/5 | Removes manual guesswork but still requires policy decisions |
| Operational safety | 4/5 | Controlled pod restarts when auto-updates are enabled |
| Workflow compatibility | 4/5 | Pairs well with HPA and Cluster Autoscaler when responsibilities are clearly split |
| Time to value | 4/5 | Benefits accumulate gradually as usage data builds |
| Scope limits | 3/5 | Focused on requests only; not a cost or utilization dashboard |
Main limitation | Can require pod restarts to apply changes, needs careful rollout |
Assessment Highlights
#1. Top-notch request rightsizing
VPA’s biggest advantage is that it eliminates guesswork from rightsizing and replaces it with data. Since Kubernetes scheduling is driven by requests, VPA directly attacks one of the most common hidden cost drivers by correcting inflated requests. It does this through: 1) continuous observation of CPU and memory usage, 2) data-driven target request recommendations.
#2. Controlled automation
VPA offers multiple operating modes, allowing teams to adopt it gradually without jumping straight into disruptive automation. This makes it safer to introduce in production environments with varying risk tolerance.
Controlled automation with VPA enables the following:
- Recommendation-only (Off), apply-on-create (Initial), and auto-update (Auto) modes;
- Guardrails (like minAllowed and maxAllowed values);
- Ability to scope changes to CPU, memory, or specific workloads;
- Gradual rollout starting with low-risk, stateless services.
#3. Compounding cost savings
When VPA drives requests down to match real demand, three good things tend to happen:
> Improved bin-packing. More pods fit on existing nodes, reducing unnecessary scale-ups. VPA provides realistic scheduling signals, thus making Cluster Autoscaler more effective.
> Reduced idle capacity. Waste from padded requests and half-empty nodes shrinks. VPA removes excess allocation that blocks consolidation.
> Less manual rightsizing. VPA continuously learns from usage, minimizing recurring tuning and stale request adjustments.
For IBM environments, you can also maximize your savings with a IBM Cloud Kubernetes 25% discount.
Kube-Downscaler
Best for: quick wins from turning off non-prod on a schedule
Kube-Downscaler is built for reducing Kubernetes spend through scheduled shutdowns for non-prod. You define when dev, QA, and staging workloads can scale down, and it automatically does so during idle periods, then restores them when activity resumes.
| Area | Rating | Highlights |
| Cost impact | 5/5 | Turns predictable off-hours in dev, QA, and staging into immediate, repeatable savings |
| Simplicity | 5/5 | Uses schedules instead of complex optimization or allocation models |
| Engineering adoption | 5/5 | Controlled via Kubernetes annotations that live with the workload |
| Granularity | 4/5 | Can be applied selectively by namespace or individual workload |
| Workflow fit | 5/5 | Complements HPA and Cluster Autoscaler rather than competing with them |
| Operational effort | 4/5 | Easy to roll out and reverse, with minimal ongoing maintenance |
| Risk control | 4/5 | Supports exclusions and minimum replica settings for critical components |
| FinOps role | 4/5 | Delivers fast “quick-win” savings without heavy FinOps tooling |
Main limitation | Schedule mistakes cause “why is staging down?” moments |
Assessment Highlights
#1. Scheduled savings from predictable downtime
Kube-Downscaler proves to be one of the most efficient mechanisms for capturing predictable non-production savings, which are enabled by:
- Easy to define downtime windows by day, time, and time zone;
- Ability to scale workloads to 0 replicas (or, alternatively, keep a minimal heartbeat);
- Selective application (by namespace or individual workload);
- No dependency on cost models, dashboards, or node pool changes.
If you want a walkthrough of a common install path, this guide is a helpful reference: install kube-downscaler with kubectl and kustomize.
#2. Low-friction adoption through annotations
Kube-Downscaler is easy to adopt because configuration lives directly on Kubernetes workloads. You add annotations (or labels, depending on your standardization) to the workloads you want to control. For example, teams commonly use patterns like:
- downscaler/downtimePeriod: “Mon-Fri 00:00-07:00”
- downscaler/minReplicas: “1”
- an exclude flag for critical namespaces or workloads you never want scaled down
Another pro is reversibility: if a schedule causes friction, you remove the annotation and the behavior stops.
#3. Clean separation from autoscaling
Kube-Downscaler is not trying to be HPA, VPA, or Cluster Autoscaler. It fills a different gap: planned downtime.
A practical way to use it without getting burned is to keep a short list of “never scale down” components, like:
- shared ingress controllers used by multiple environments;
- core monitoring and logging (at least the parts you need for troubleshooting);
- CI runners or build agents that operate after hours.
Handled well, Kube-Downscaler becomes one of those rare tools that improve both sides: lower bills and fewer operational reminders about forgotten non-prod environments.
Prometheus + Grafana
Best for: building your own cost dashboards and alerts
Prometheus and Grafana are widely adopted, well understood, and easy to hire for. That matters when the dashboards become part of your weekly operating rhythm.
Together, they represent the classic “build it your way” approach to cost and resource visibility. Based on a hands-on assessment, this stack offers maximum flexibility to help teams design highly customized dashboards and monitoring models (that can be tailored to their infrastructure, workloads, operational priorities, etc.).
However, from what we’ve observed, this flexibility comes with a clear tradeoff: the tooling provides rather raw observability power. Consider that its meaningful cost insights depend heavily on correct metric selection, instrumentation quality, and ongoing dashboard maintenance, to name a few.
| Area | Rating | Highlights |
| Cost visibility approach | 5/5 | Treats cost like any other production metric: time-series, labeled, charted, and alerted on. |
| Engineering alignment | 5/5 | Uses the same labels, dashboards, and workflows engineers already rely on. |
| Root-cause analysis | 5/5 | Makes cause-and-effect clear by correlating cost with CPU, memory, restarts, and deployments |
| Flexibility | 5/5 | Fully customizable dashboards and queries tailored to team-specific cost questions |
| Integration with allocation data | 4/5 | Works best when paired with OpenCost-style metrics for workload-level cost signals |
| Alerting capability | 4/5 | Supports early, actionable cost alerts (spend spikes, idle cost, runaway workloads) |
| Adoption & skills | 5/5 | Widely adopted, well understood, and easy to hire for |
| Scope limits | 3/5 | Strong for infra and Kubernetes costs, but not for SaaS or non-metric spend |
| FinOps role | 4/5 | Ideal for teams that want custom, real-time cost dashboards rather than a packaged FinOps UI |
Main limitation | No cost math by default, you must wire in exporters/data sources |
Assessment Highlights
#1. One metrics language across teams
Prometheus and Grafana work well for cost visibility because they rely on familiar monitoring primitives: time-series metrics and labels. Since cost and usage share the same structure, teams can thus align well without creating a separate reporting layer.
This shared language enables:
> A single pane of glass for cause and effect, with cost panels shown next to CPU, memory, and restart metrics
> Label-driven accountability using existing dimensions like team, service, and environment
> Faster feedback loops, where engineers respond to concrete rollout-linked cost changes instead of abstract monthly spend trends
#2. Cost dashboards built from real usage
While Prometheus alone is not a billing system, it becomes powerful for cost analysis when paired with the right inputs (for example, with tools like OpenCost).
Once cost metrics land in Prometheus, Grafana becomes your playground. There, you can build dashboards that answer core questions and concern areas, like the ones displayed below.
| Core Concern / Goal | Suggested Grafana Panel |
| Identifying cost drivers behind spend spikes | Cost by team / label over time |
| Distinguishing real usage from padded requests | Request vs. usage gap by namespace / workload |
| Understanding what changed before cost shifts | Cost trends with deployment / pod churn overlays |
| Detecting idle capacity and consolidation blockers | Idle allocation alongside node utilization |
| Spotting inefficient clusters and environments | Multi-cluster cost heatmap |
If you’re running a bigger observability setup and using Datadog alongside open source, Spendbase’s Datadog discounts up to 40% off is a practical option to reduce tool overhead while you keep Prometheus and Grafana for custom cost views.
#2. Alerts for early waste detection
Prometheus alert rules (typically routed through Alertmanager, and sometimes Grafana alerting) let you trigger notifications when costs behave like an incident.
Cost alert patterns that work well in real teams:
- Spend spike alerts by owner. Trigger when the cost in a namespace or team label rises above a baseline (day-over-day or week-over-week), + route the alert to the owning Slack channel.
- Runaway workload alerts. Triggered when a job exceeds its expected cost envelope, particularly valuable for batch workloads and GPU nodes where errors can rapidly escalate spend.
- Idle cost alerts. Notify when idle allocation crosses a threshold for a sustained period (a clear signal to revisit requests, bin-packing, node autoscaling).
- Budget drift alerts (lightweight) – to monitor spending pace by comparing projected month-end costs against the planned budget.
Also, consider: alert discipline matters. If you fire 40 cost alerts a day, everyone will mute them. A good rule is to alert on things that are both actionable and unusual, then keep dashboards for everything else.
AWS Compute Optimizer (with open wrappers)
Best for: tracking rightsizing signals for AWS users
AWS Compute Optimizer delivers high-confidence rightsizing signals for AWS resources based on native utilization data.
If your infrastructure is mostly AWS, AWS Compute Optimizer is one of the most “signal-rich” inputs you can add to cost work. While not open source, it’s most valuable when you treat it as an always-on recommendation feed, then combine it with open source tools that explain ownership (allocation) and prevent backsliding (guardrails).
To better understand AWS’s framing, do this: 1) start with the official AWS Compute Optimizer overview, 2) explore AWS cloud cost optimization best practices for a broader context.
| Area | Rating | Highlights |
| Rightsizing quality | 5/5 | Produces specific, resource-level recommendations (instance family/size), not just spend charts |
| Signal trust | 5/5 | Anchored to AWS-native telemetry, reducing data stitching and accuracy debates |
| Risk awareness | 4/5 | Flags both overprovisioning (waste) and underprovisioning (performance risk |
| Coverage depth | 4/5 | Supports broad, real-world AWS fleets across instance families and Auto Scaling Groups |
| Time-to-value | 4/5 | Fast to adopt since it’s built into AWS with minimal setup |
| Automation readiness | 4/5 | Recommendations can be exported and automated via lightweight wrappers and workflows |
| Operational overhead | 4/5 | Low ongoing maintenance, with AWS owning most of the platform complexity |
| Open-source fit | 4/5 | Complements open tools by acting as a rightsizing signal, not an allocation or governance layer |
| Scope limits | 3/5 | AWS-focused; does not replace Kubernetes allocation, IaC estimates, or policy enforcement |
Main limitations | Limited to AWS resources, no Kubernetes-native context, dependent on historical usage patterns |
Compared to open source cost tools, Compute Optimizer wins in a narrower but critical role: delivering accurate and actionable rightsizing guidance for AWS infrastructure. This way, it proves to be ahead in day-to-day AWS operations in the following days:
- Less time spent wiring data
- Lower ongoing maintenance (unlike open source platforms, no upgrades, permissions tuning, or reliability work needed).
- Cleaner “what should I do next?” output, recommending specific configurations
- Better fit for hybrid EC2 and Auto Scaling Group realities.
Assessment Highlights
#1. High-confidence rightsizing signals
Compute Optimizer stands out because it is deeply integrated into AWS and analyzes AWS-native utilization signals. Teams typically value it for several practical reasons:
- AWS-native telemetry, no need to reconcile multiple data sources, reducing analysis friction;
- Actionable recommendations, with resource-level guidance;
- Waste + risk balance, addressing both over- and underprovisioning;
- Broad AWS coverage, particularly across mixed instance families and generations;
- Consistent optimization playbooks across accounts.
Considering all the above-mentioned aspects, note that Compute Optimizer becomes most valuable when integrated into workflows.
#2. Automation through open wrappers
Compute Optimizer delivers immediate value, but the real gains come when recommendations are embedded into workflows rather than reviewed sporadically.
The practical approach is simple: integrate findings into existing processes and automate repetitive actions. This includes:
- Exporting recommendations to S3 or a data warehouse for operational analysis;
- Routing actions via Slack or tickets directly to workload owners;
- Applying safety guardrails (low-risk services, gradual downsizing);
- Detecting drift from manual or automated resizing.
A practical starting point is the compute-optimizer-automation sample repository, which shows how recommendations can be turned into repeatable actions without building a full platform.
GCP Recommender API (with open clients)
Best for: easy-to-automate cleanup for GCP
GCP Recommender API provides an automation-friendly feed of GCP-native rightsizing, idle cleanup, and discount recommendations.
For best use, we recommend this: use open source for ownership, allocation, and guardrails, then use the GCP Recommender API as the “automation-friendly action list” that keeps cleanup from turning into a quarterly fire drill.
| Area | Rating | Highlights |
| Actionability | 5/5 | Delivers concrete, resource-level actions rather than dashboards or summaries. |
| Signal trust | 5/5 | Based on Google Cloud’s own telemetry, reducing guesswork and accuracy debates |
| Cleanup effectiveness | 5/5 | Strong at identifying idle and underused VMs, disks, and addresses (“zombie” waste) |
| Automation readiness | 5/5 | API-first design with open clients enables scripted cleanup, routing, and guardrails |
| Governance tolerance | 4/5 | Produces useful recommendations even when labels or tagging are incomplete |
| Cost to try | 4/5 | Most recommendations are generated at no additional cost, lowering adoption friction |
| Integration fit | 4/5 | Complements open source tools by acting as a GCP-specific action layer |
| Operational overhead | 4/5 | Low, especially when used via lightweight scheduled jobs instead of a platform |
| Scope limits | 3/5 | GCP-only; does not replace cross-cloud allocation, dashboards, or policy enforcement |
Main limitations | No cross-cloud visibility, requires validation before changes, recs vary by service coverage |
Assessment Highlights
Provider-grade cleanup signals
Unlike most projects that start with inventory and dashboards, Recommender starts closer to the finish line: concrete recommendations tied to GCP resource behavior. This in turn, leads to several next-level advantages:
- Provider-grade signals. Recommendations from Google Cloud’s native analysis reduce guesswork and debates over utilization.
- Strong zombie waste coverage. Recommender reliably flags idle or underused resources like VMs, disks, and addresses.
- Automation-first design. API-driven workflows make it easy to operationalize daily cleanup routines.
- Resilient to imperfect tagging. Useful findings remain available even when governance is still maturing.
- Low experimentation barrier. Most recommendations are generated at no cost. (Availability varies by channel; see Recommender pricing.)
#2. Automation-first by design
Recommender is built to be consumed programmatically, which makes it easy to integrate cleanup into existing workflows without standing up a new platform.
Many teams start to use the Recommender API with small tasks that run daily and cover these 3 functions: 1) pull recommendations from the Recommender API, 2) route them to the right owner (Slack, email, Jira), 3) optionally apply low-risk changes after guardrails.
In regard to this, a simple, safe automation pattern looks like this:
> Step 1 (read-only). List recommendations for core cost areas and store outputs for review.
> Step 2 (owner routing). Assign recommendations via labels or project structure to ensure clear ownership.
> Step 3 (guardrail apply). Automate low-risk actions while requiring approval for production-impacting changes.
Plus, for extra gains, consider how to claim free Google Cloud credits to avoid wasting credits while you tune usage.
Spendbase
Best for: next-level time, control, and savings
While open source cost tools might be effective, they often require stitching multiple solutions together. Most of them specialize in only one area (either visibility, control, or enforcement. Spendbase targets these gaps.
Spendbase is a paid alternative focused on faster time-to-value, tighter spend control, and savings across the entire IT stack. Beyond cloud, it serves as a SaaS spend analysis tool and the ultimate cost management solution, incorporating the following;
- Virtual cards for utmost spend control, with enforced guardrails upfront with limits, ownership, and clearer tracking;
- Software audit & usage visibility to help teams identify who uses what to reclaim seats, cut unused licenses, and reduce overlap;
- Price benchmarking & negotiation support, improving renewal terms, and uncovering savings opportunities;
- Automated procurement control with Slack approval workflows, enabling faster decisions, clearer ownership, and consistent enforcement of budget guardrails.
In doing so, Spendbase delivers a range of benefits that most open source stacks struggle to match:
> Faster time-to-value
Spendbase focuses on delivering a 360-degree operational view across all areas: usage, waste, renewals, budget drift, and more (in contrast, open-source stacks require integrations and workflow design).
> SaaS visibility beyond infrastructure
Infra tools expose cloud signals but not inactive licenses. Spendbase, in turn, surfaces unused or excessive SaaS seats and app-level waste.
> Shadow IT reduction
Open tooling rarely catches off-process SaaS purchases. Unlike them, Spendbase helps identify shadow IT, improving both cost control and security hygiene.
> Proactive budget tracking
Allocation alone doesn’t answer “Are we tracking to plan?”. Therefore, Spendbase emphasizes real vs. planned spend visibility for earlier intervention.
Cloud Cost Optimization Tools (2026): Feature Breakdown | ||||||||||
| Spendbase | Kubecost | OpenCost | Infracost | Cluster Autoscaler | Kubernetes VPA | Kube-Downscaler | Prometheus + Grafana | AWS Compute Optimizer | GCP Recommender API | |
| Cloud cost visibility | ✅ | Partial | Partial | ❌ | ❌ | ❌ | ❌ | Partial | Partial | Partial |
| Kubernetes cost allocation | ✅ | ✅ | ✅ | ❌ | ❌ | ❌ | ❌ | ✅ | ❌ | ❌ |
| Multi-cloud support | ✅ | Partial | ✅ | ✅ | ✅ | ✅ | ✅ | ✅ | ❌ | ❌ |
| Idle / waste detection | ✅ | ✅ | ✅ | ❌ | ✅ | ✅ | ✅ | ✅ | ✅ | ✅ |
| Rightsizing recommendations | ✅ | Partial | Partial | Partial | Partial | ❌ | ❌ | ❌ | ✅ | ✅ |
| Automation / actions | ✅ | Partial | Partial | Partial | ✅ | Partial | ✅ | Partial | Partial | ✅ |
| Policy guardrails | ✅ | ❌ | ❌ | ✅ | ❌ | ❌ | ❌ | ❌ | ❌ | ❌ |
| Spend prevention | ✅ | ❌ | ❌ | ❌ | ❌ | ❌ | ❌ | ❌ | ❌ | ❌ |
| Budget vs actual tracking | ✅ | ❌ | ❌ | ❌ | ❌ | ❌ | ❌ | ❌ | ❌ | ❌ |
| Shadow IT detection | ✅ | ❌ | ❌ | ❌ | ❌ | ❌ | ❌ | ❌ | ❌ | ❌ |
| Vendor price benchmarking | ✅ | ❌ | ❌ | ❌ | ❌ | ❌ | ❌ | ❌ | ❌ | ❌ |
| Vendor negotiation support | ✅ | ❌ | ❌ | ❌ | ❌ | ❌ | ❌ | ❌ | ❌ | ❌ |
| Procurement workflows | ✅ | ❌ | ❌ | ❌ | ❌ | ❌ | ❌ | ❌ | ❌ | ❌ |
| Virtual cards / spend controls | ✅ | ❌ | ❌ | ❌ | ❌ | ❌ | ❌ | ❌ | ❌ | ❌ |
For broader evaluation criteria, explore these sources:
- Cloud cost governance using Kubecost, OpenCost, and Infracost;
- CloudZero’s 2026 FinOps platforms buyer’s guide;
- Top SaaS spend management software.
Summing up
If you’re trying to choose an open source cloud cost optimization tool in 2026, the hardest part is that they don’t all “compete” in the same lane. Overall, cloud cost optimization tools can be broken down into 3 core use cases and functionality areas:
> Measure (allocation and visibility): Kubecost, OpenCost, Infracost, Prometheus, Grafana, Komiser, OptScale
> Prevent (policy guardrails): Infracost, Cloud Custodian
> Act (autoscaling and scheduled shutdowns): Cloud Custodian, Cluster Autoscaler, Kubernetes VPA, Kube-Downscaler, StormForge
To make the right choice, begin with a clear assessment of your needs. If your goal is comprehensive cost optimization across both cloud and SaaS, Spendbase is often chosen as the strongest option.


Get discounts on your team’s favorite apps
Find deals for 10%, 30%, or even 70% off in our discount marketplace.
Check Discounts