









Budget Infographics Discount - Up to 20% off
Provides government and taxpayers an easy way to navigate, visualize and understand a city, county or school budget.
Get discountCategory
Budgeting Software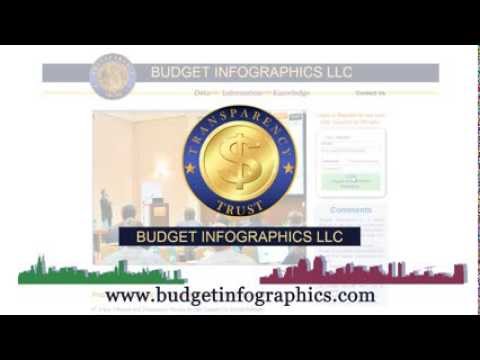
What is Budget Infographics?
Budget Infographics is a software tool designed to help governments and taxpayers easily navigate, visualize, and understand city, county, or school budgets. Its main features include intuitive data visualization, customizable charts, interactive graphs, and dashboard snapshots that highlight key performance indicators. The software also offers advanced analysis tools, such as predictive analytics for forecasting future expenses, and seamless integration with existing accounting software. These features aim to simplify financial management and enhance transparency in public budgeting processes.
- Interactive visualization of government budgets
- User-friendly navigation for nontechnical taxpayers
- Empowers officials with quick budget insights
- Web-based, end-to-end budgeting infographic solution
- Saves time through automated design workflows
- Accessible to users without design experience
Eligibility
Number of Seats/Users: Budget Infographics offers discounts based on the number of users or seats. A higher volume typically leads to a better discount structure, especially for enterprise-level usage.
Commitment to a Long-Term Contract: Discounts are often provided to companies that commit to using the service for a longer period (e.g., 1-year or 3-year contracts). A longer commitment shows Budget Infographics that the company is serious and willing to invest in the platform long-term.
No Active Discounts: Companies that are not already receiving other active discounts may have a better chance of qualifying for additional discounts from Budget Infographics. Budget Infographics reserves discounts for new customers or those not currently under promotional pricing.
Volume or Usage Commitment: Budget Infographics offers discounts if you agree to a minimum amount of usage or transaction volume. This could be based on data storage, transactions, or other metrics tied to how much you will use the platform.
Enterprise-Level Negotiation: Companies that qualify as “enterprise” due to their size or complexity (e.g., having large teams, multiple departments, or geographical presence) may be eligible for additional discounts from Budget Infographics. Such companies are often in a position to negotiate for better pricing.
Early Renewal or Prepayment: Budget Infographics often offers discounts if you renew early or prepay for the entire contract period. This is a common approach to securing a lower price.

Budget Infographics - Up to 20% off
Reviews
Here at Spendbase our internal data shows that Budget Infographics hits a very clear sweet spot: it’s built for non-designers who need to communicate complex public budgets in a clean, visual way, without spending hours (or hiring an agency).
Key strengths our Spendbase clients highlight
– Very easy to use
– Non-design staff can produce visual budgets without prior training.
– Interface is described as “user‑friendly” and “easy to navigate.”
– Huge time saver
– Converts raw budget data into visuals quickly.
– Cuts down on back-and-forth with design teams.
– Great for public sector transparency
– Ideal for city, county, and school budgets.
– Elected officials get “quick access to information” in a format that’s easy to explain to taxpayers.
– Good all‑in‑one web app
– End‑to‑end workflow for budget visualization.
– Design presets help people who “have no design experience” start fast.
Main pain points we see
– Limited for advanced designers
– Spendbase clients with in‑house graphic designers feel it can be restrictive.
– One theme: “If you’re a graphic designer it’s not for you.”
– Desire for richer visuals
– Some clients want more chart types, styling options, and updated graphics libraries.
How this maps to value and discounts
From a cost-optimization view, our internal data suggests:
– Best fit for:
– Municipalities, school districts, and agencies with small or no design teams.
– Finance and budget offices that currently rely on static spreadsheets or basic PDFs.
– Watch-outs:
– If you already pay for high-end design suites and employ designers, you may not need Budget Infographics for those users. We typically recommend limiting licenses to non-design stakeholders and decision-makers.
– Discount opportunities we usually target:
– Tiered pricing based on number of non-design users.
– Better terms for multi-year commitments where transparency and citizen communication are long-term priorities.
In short, Spendbase clients see Budget Infographics as a high-ROI tool for making public budgets understandable and shareable, as long as expectations around advanced design customization are set correctly.
See how much you can save on your stack
Pick your team’s tools!
Click to select one or more tools.


What’s your company size?
Just click to select.
What’s your business email?
We'll send you calculations right away
The email is flying to your inbox!
Beyond discounts, you may qualify for up to $100K in AWS credits.

FAQ
1. What types of budget infographics do you offer?
We provide a variety of budget infographics, including charts, graphs, and tables, suitable for presentations and financial planning.
2. Are the budget infographics compatible with different software?
Yes, our infographics are compatible with Microsoft PowerPoint, Apple Keynote, Google Slides, and Canva.
3. Do you offer discounts on budget infographic templates?
Yes, we offer discounts up to 35% on our budget infographic templates during promotional periods.
4. How can I apply a discount code to my purchase?
Enter the discount code at checkout to apply the savings to your order.
5. Are there any free budget infographic templates available?
Yes, we offer a selection of free budget infographic templates for download.
6. Can I customize the colors and fonts in the infographics?
Absolutely, our templates are fully editable, allowing you to customize colors, fonts, and other elements to fit your needs.
7. Do you provide support for editing the infographics?
Yes, we offer customer support to assist you with editing and customizing your infographics.
8. Is there a limit to how many times I can use a purchased template?
No, once purchased, you can use the template as many times as you like for your projects.
Related discounts

Primavera Unifier Accelerator
Budgeting Software
Up to 30% off

Rapidstart
Budgeting Software
Up to 30% off

AWS Budgets
Budgeting Software
Up to 25% off

TruePlan
Budgeting Software
Up to 15% off

Planacy
Budgeting Software
Up to 35% off

BluePlanner
Budgeting Software
Up to 45% off
Software cost optimization
Budget Infographics savings in five steps
Let’s estimate your potential savings and see how you can scale your cloud infrastructure.
One call. No cost. No commitments


meet vendor relationship EXPERTS
Our customers save millions with us



Save on Budget Infographics
It’s time to shrink your bill
Let our SaaS cost optimization experts check what deals you can get and how much you can save on your corporate subscriptions
See how you can:
- Learn about pricing benchmarks and discounts
- Present potential savings by vendor to your team
- Meet your SaaS and cloud cost optimization goals
Get Budget Infographics discount
We’ll email you back within 1 business day